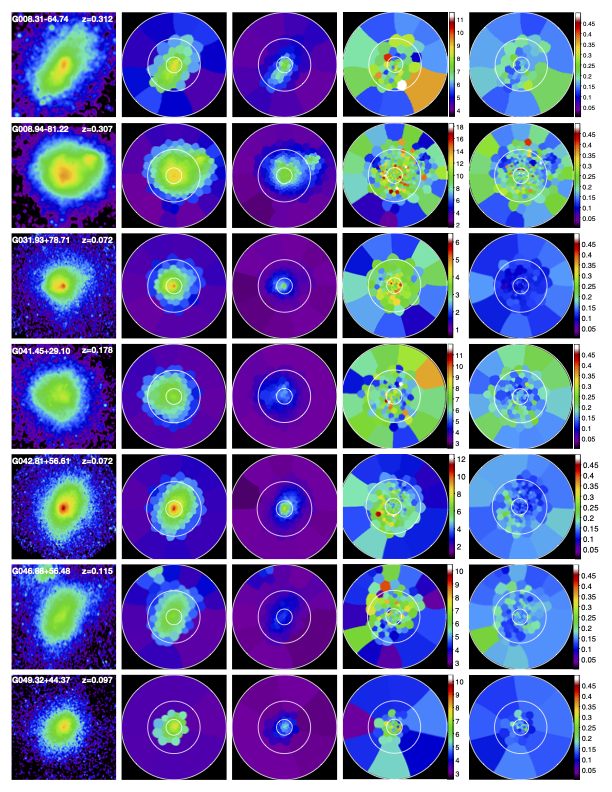
Two-dimensional maps that allowed us (Lovisari, Ettori et al. 2023, A&A, submitted) to study the perturbations in the temperature (and density) distribution, evaluating and characterizing the level of inhomogeneities of the ICM in a subsample of the CHEX-MATE (website: http://xmm-heritage.oas.inaf.it/; reference: CHEX-MATE collaboration 2021 / https://ui.adsabs.harvard.edu/abs/2021A%26A…650A.104C/abstract) galaxy clusters.
(From left to right) bkg-subctracted and exposure-corrected XMM-Newton images in the 0.3-7 keV band; binned X-ray surface brightness maps; projected electron density maps; projected temperature maps obtained through the Weighted Voronoi Tesselation (WVT) method by requiring a signal-to-noise ratio S/N~30 ; relative temperature error maps. The size of the boxes corresponds to R500 (~0.6 times the virial radius); the white circles in the Voronoi maps corresponds to 0.15 R500, 0.5 R500, and R500.